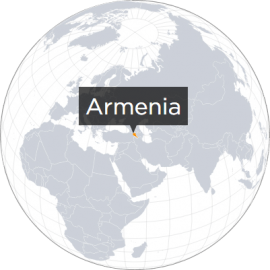
Armenia (61st) has seen its prosperity improve most in Eastern Europe over the past decade, rising almost 20 places. It has made significant progress in decreasing levels of crime, halving its homicide rate since 2011.
The Prosperity Index has been developed as a practical tool to help identify what specific action needs to be taken to contribute to strengthening the pathways from poverty to prosperity and to provide a roadmap as nations chart their way through and out of the pandemic. The Index consists of 12 pillars of prosperity, built upon 67 actionable policy areas (elements), and is underpinned by 300 indicators.
The Index has been designed to benefit a wide range of users, including political leaders, policymakers, investors, business leaders, philanthropists, journalists, and researchers.
Political leaders can use it to help shape priorities for a policy agenda;
Policymakers can use it to determine specific areas that require action to help increase prosperity;
Investors can use it to inform capital allocation;
Business leaders can use it to identify and communicate the changes they need to improve the business climate and the productive capacity of nations;
Philanthropists can use it to identify the areas where they can have the greatest impact beyond the well-trodden paths;
Journalists can use it to hold governments to account;
Researchers can use it to complement other datasets to analyse the underlying patterns behind development, and inform the broader policy, business, and philanthropic community.
Interpreting the Index
For 167 nations, the Index uses the same indicators, and combines them in the same way to create elements and pillars. By using the Index, it is possible to compare the relative performance of each country for overall prosperity and each of the 12 pillars of prosperity, such as health, education, and social capital, as well as the 67 elements within the pillars. The elements have been established to represent key policy areas, such as investor protections, primary education, government integrity, and air pollution, to help facilitate more targeted action.
Making these comparisons will enable the user to explore which aspects of prosperity are more or less well developed within a country, and how countries compare with others. The higher the ranking, the stronger the performance of that country for the pillar or element, when compared with a country lower down the rankings. Further to this, the Index also provides data over a 15-year period, making it possible to see whether prosperity has been strengthening or weakening over time, and what specifically is driving that change. This will enable areas of strength to be built on and areas of weakness to be addressed.
Applying the Index
The data in the Index and analysis contained in the report can be used for a variety of purposes, for example:
Benchmarking performance against peers;
In-depth analysis of prosperity at the country level;
Understanding whether prosperity is improving or weakening over time, and why;
Identifying the binding constraints to increased prosperity;
Informing priorities for setting country agendas.
Where a country is showing a strong or weak performance in a pillar, it is possible to drill down and identify what particular policy-related element is driving this trend. Within each element, the specific indicators represent proxies, and each one should be interpreted as indicative. This will help inform the required policy action to strengthen performance.
For example, it may be discovered that a country’s poor prosperity rankings are driven by a weak performance in education. Upon further investigation, the Index reveals that, although current education policy in the country is weaker in primary education, it has been focused on improving secondary education when contrasted with regional comparator countries. In particular, further investigation of the Index reveals that low completion rates may be driving the weak performance in primary education. This information can help to target specific areas that need improvement and provide a starting point for what can be done to improve education, and thereby increase prosperity.
By using the historical data provided by the Index for the example above, it may become apparent that primary completion rates have declined rapidly over the past three years. Discussion with local education officials on the decline may reveal that this coincides with the introduction of a new exit exam that pushes students out of school who do not pass, thus pointing to the particular area where action is needed.
Resources Available
There are several tools available to aid analysis and
interpretation of, and elicit insight from, the Prosperity Index. Alongside
this report,which provides a high-level analysis of the findings from the
Index, the following additional information can be found via our website
www.prosperity.com:
Country profiles. This 15-page profile for each
country provides more detailed pillar, element, and indicator information,
including rankings and scores, and how these have changed over time.
Indicator scores. An Excel spreadsheet, which can be
downloaded, contains the scores for all of the 300 indicators for each year
since 2007. Using these scores, the user can carry out more in-depth analysis.
Team members at the Legatum
Institute are available to engage and provide support to those interested in
addressing the challenges and opportunities presented by these materials.
Please contact us at info@li.com.
Using the Index
Political leaders
This report provides leaders at a national and local level with an overview of their
country’s performance across the 12 pillars of prosperity and provides the
foundation for setting an agenda to create pathways from poverty to prosperity.
These can be developed and refined using the more in-depth accompanying
resources.
Policymakers
The Index and its accompanying resources allow policymakers to benchmark nations’ performances against peers across 12 pillars and 67 elements of prosperity to create a much more granular perspective of performance and the potential binding constraints to development.
Each of the 67 elements of prosperity have been designed to be recognisable, discrete areas of domestic policy, and measured using a combination of indicators from a variety of public data sources. The indicators should be interpreted as a set of proxies for the underlying policy concept and we would encourage policymakers to interpret a country’s score and rank for an element as the trigger for more fundamental analysis of the strengths and weaknesses of its performance. Benchmarking against a basket of international metrics must be complemented by in-depth, context-sensitive analysis, which itself can lead to more balanced agendas across a range of policy areas.
In addition to helping focus analysis, these materials, together with the database of performance, also allow policymakers to develop diagnostic tools and to identify potential options to consider, based on the performance of other countries, and the case studies provided.
Philanthropists
Beyond the familiar humanitarian and living conditions-focused efforts, there are many opportunities to invest in building stronger social, political, and economic outcomes. For example:
Governance:
While there is already extensive NGO engagement in activities such as monitoring elections, many more upstream opportunities exist to support capability building within governments. This is not only developing the organisational capital, but also providing professional experience across all the technical aspects of the machinery of government, such as strategic planning and judicial functions. This need not be direct support, but could be an enabling or financing role.
Social Capital:
Institutional and interpersonal trust are two critical factors that will help the countries of the world build true prosperity. However, these are less-understood areas, and there is a unique role for philanthropists to identify and champion what it takes to increase trust and build social capital.
Enterprise Conditions:
Some NGOs have enhanced prosperity at a local level by working with local businesses to identify barriers to starting, operating, and growing businesses, and developing collaborative approaches to resolving them at a local and national level.
Infrastructure:
Ensuring that large-scale programmes deliver on their potential for the broader population can be very challenging when inadequate attention is paid to last-mile challenges, whether it be access to roads, electricity connections, or mobile coverage. Measurements of levels of access help overcome this
Investor and Business Leaders
The business community is well positioned to identify barriers to starting, operating, and growing business, and to demonstrate to government the economic potential from reforms such as lifting onerous regulation. Likewise, business leaders and investors can work with government to improve the investment environment, contributing to the strengthening of investor protections and corporate governance, as well as identifying the potential from improved contract enforcement in many jurisdictions.
Furthermore, business leaders and investors can contribute to infrastructure policy development by demonstrating the economic impact of investment in communications, transport, and energy projects, where they can be the binding constraint on development.
Academics and Researchers
For academics and researchers, our database of curated indicators is a unique resource enabling cross-country comparison of trends and patterns across the past 13 years for much of the data.
By providing a holistic dataset across many disciplines, it provides an opportunity to compare in a straightforward way the impact of disparate factors such as how political terror is related to education levels, or property rights with reserves of renewable water.
Journalists and civil society
The Prosperity Index is based on publicly available and verifiable data, which means it can be a powerful resource for those who want to hold up a mirror to those in power and society at large. Holding leaders to account is a crucial role for both journalists and civil society. The institutional, economic, and social performance of a nation is critical to its prosperity, and having non-government actors calling out weaknesses, as well as celebrating successes, can help spur on national leaders. To do so well requires easy access to reliable data that can be represented in a digestible way.
The Pathways to Transformation
The pathways from poverty to prosperity are not necessarily uniform. When confronted with many challenges, navigating them can often seem like an overwhelming task. From our research and engagement with national leaders, three important themes inform the appropriate response to addressing the challenges.
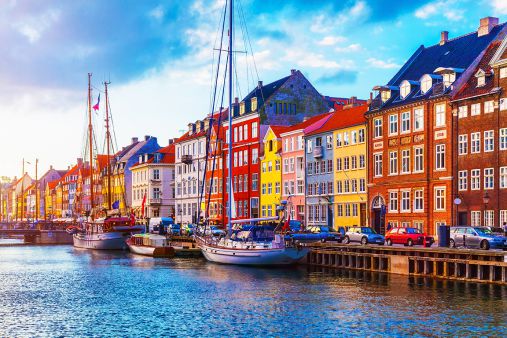
Transformation is a process, not an event. For countries in the middle ranks of the Index, it is not necessary, or useful, to aspire to be Denmark – at least in the medium term. Intermediate benchmarks are much more helpful and effective.
Iterative changes are often more powerful than striving for an ideal on any one dimension. Given the highly complex nature of development, many factors impinge on others. There is little value in having a highly efficient, or even ‘ideal’, system of contract enforcement if the forms of corporate governance, investor protections, or property rights are much less developed. In fact, a lopsided approach can be detrimental, as it can generate unintended consequences. Each change of the ecosystem needs to move from one (relatively) stable state to another. These are often described as ‘second-best institutions’, but they are often the next-best solution.
It is important to identify the most binding constraint to development, and use it to inform sequencing and prioritisation. To give a rather simplified example, a country may find itself with a weak environment for foreign investment and also weak property rights. In such a situation, loosening restrictions on foreign investment is unlikely to have much of an impact, as investors will be wary of securing a return if property rights are not adequately protected. In such a circumstance, improving property rights would likely be a more impactful first step.
Of course, the specifics of each country’s circumstances will be critical to determining the prioritisation. The Index provides a set of hypotheses to test. The areas of highest priority will likely be those that are performing relatively poorly, but not necessarily the weakest-performing elements, as creating the conditions to warrant improving the weakest performing elements may require improving some of the elements that are less weak first. Each country has its own unique history and set of starting conditions. Nowhere is starting from a blank sheet.
That said, when looking at the progression of those countries that have had the most successful development trajectories, it is clear that establishing safety and security, adequate personal freedoms, and broadly principled systems of governance are generally pre-requisites to building a functioning economy. Within the economic sphere, a broadly stable macro-economic environment, together with enforceable property rights are usually sufficient to kick-start economic progress. Improving the regulatory environment (whether the ease of doing business, or flexibility of the labour market) can help, but the prevalence of informal economic systems around the world, as well as the varying development pathways that countries have taken, shows they are not necessarily the most binding constraint to development. By addressing underlying institutional failures, this will also ensure that resources made available to improve people’s lived experience will result in strengthening the education and health systems and provide the living conditions that will enable the population to attain the necessary level of wellbeing.
A robust, and context-sensitive, diagnostic of the binding constraints to development is a pre-requisite to any prioritisation exercise. This will help identify whether, for example, low economic activity is a function of under-developed human capital or infrastructure on the one hand, or regulatory or investment environment weaknesses on the other.
Having seen global prosperity improve steadily between 2015 and 2019, this year’s Legatum Prosperity Index finds that prosperity has plateaued for the second year…
Having seen global prosperity improve steadily between 2015 and 2019, this year’s Legatum Prosperity Index finds that prosperity has plateaued for the second year…
The varying performance of the Index’s seven regions provide an illustration of how prosperity has plateaued. Five regions have experienced a deterioration in their…